
What’s more fun to do on Sunday morning than make breakfast, watch movies, and create infographics about your data? I DON’T KNOW. Ok, I do know but I do love the way data looks when it’s visualized. This morning I’ve been scoping about a few free tools to see what my data says about me. For a great list of infographic tools see this list on hongkiat.com I found via Paisano. I’m off to the Art Gallery to hang out with Frida and Diego. Will say hi to Banksy and Andy for you! Have an awesome day! 🙂
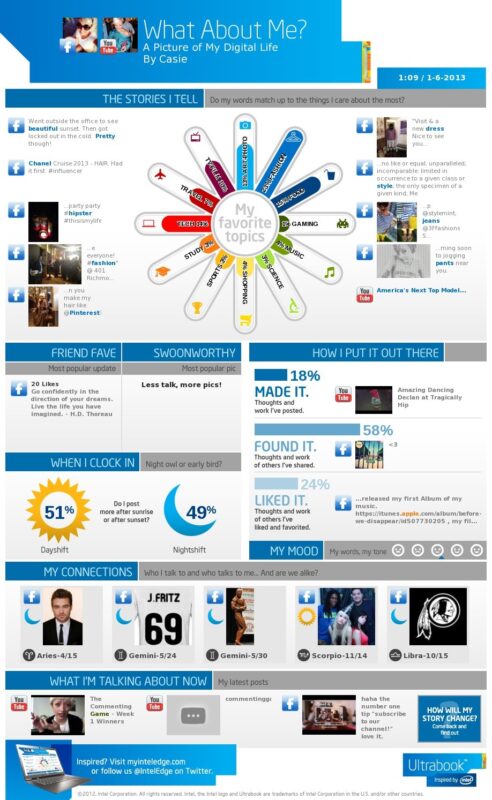

create infographics with visual.ly